Felix AnderssonSenior Fullstack Engineer, home

Montevideo

Résumé
All work

02 / 07

KnowGraph

Senior React and Rails interview prep as a map of 142 concepts. Each one is read, explained from memory, and graded by an AI against a rubric.

Role
Solo: product, curriculum, design, frontend and AI gateway
Year
2026
Interface
English and Spanish, light and dark

It needs your own LLM, so it runs on your machine: the website has the demo video, the Windows download and the source.

The story

The story

I built it to prepare my own senior interviews. 142 concepts across React and Rails, linked by what you need to understand first. The map opens on one next step, and below it a heat grid of every concept: each cell fills with its area’s color as you master it. Studying a concept takes three steps: read it, explain it in your own words, then get it evaluated against a rubric. A Socratic mentor is one click away while you work.

Scores run from 0 to 120. 100 means the base is covered and the concept counts as mastered; 101 to 120 is extra depth, marked with a star, there to push back on the grade inflation LLMs tend toward. Flashcards run on spaced repetition: each rating reschedules the card, and it comes back on the day it is due. Everything is local-first and bring-your-own-key: progress stays in IndexedDB, and the AI gateway never stores anything.
In the screenshot
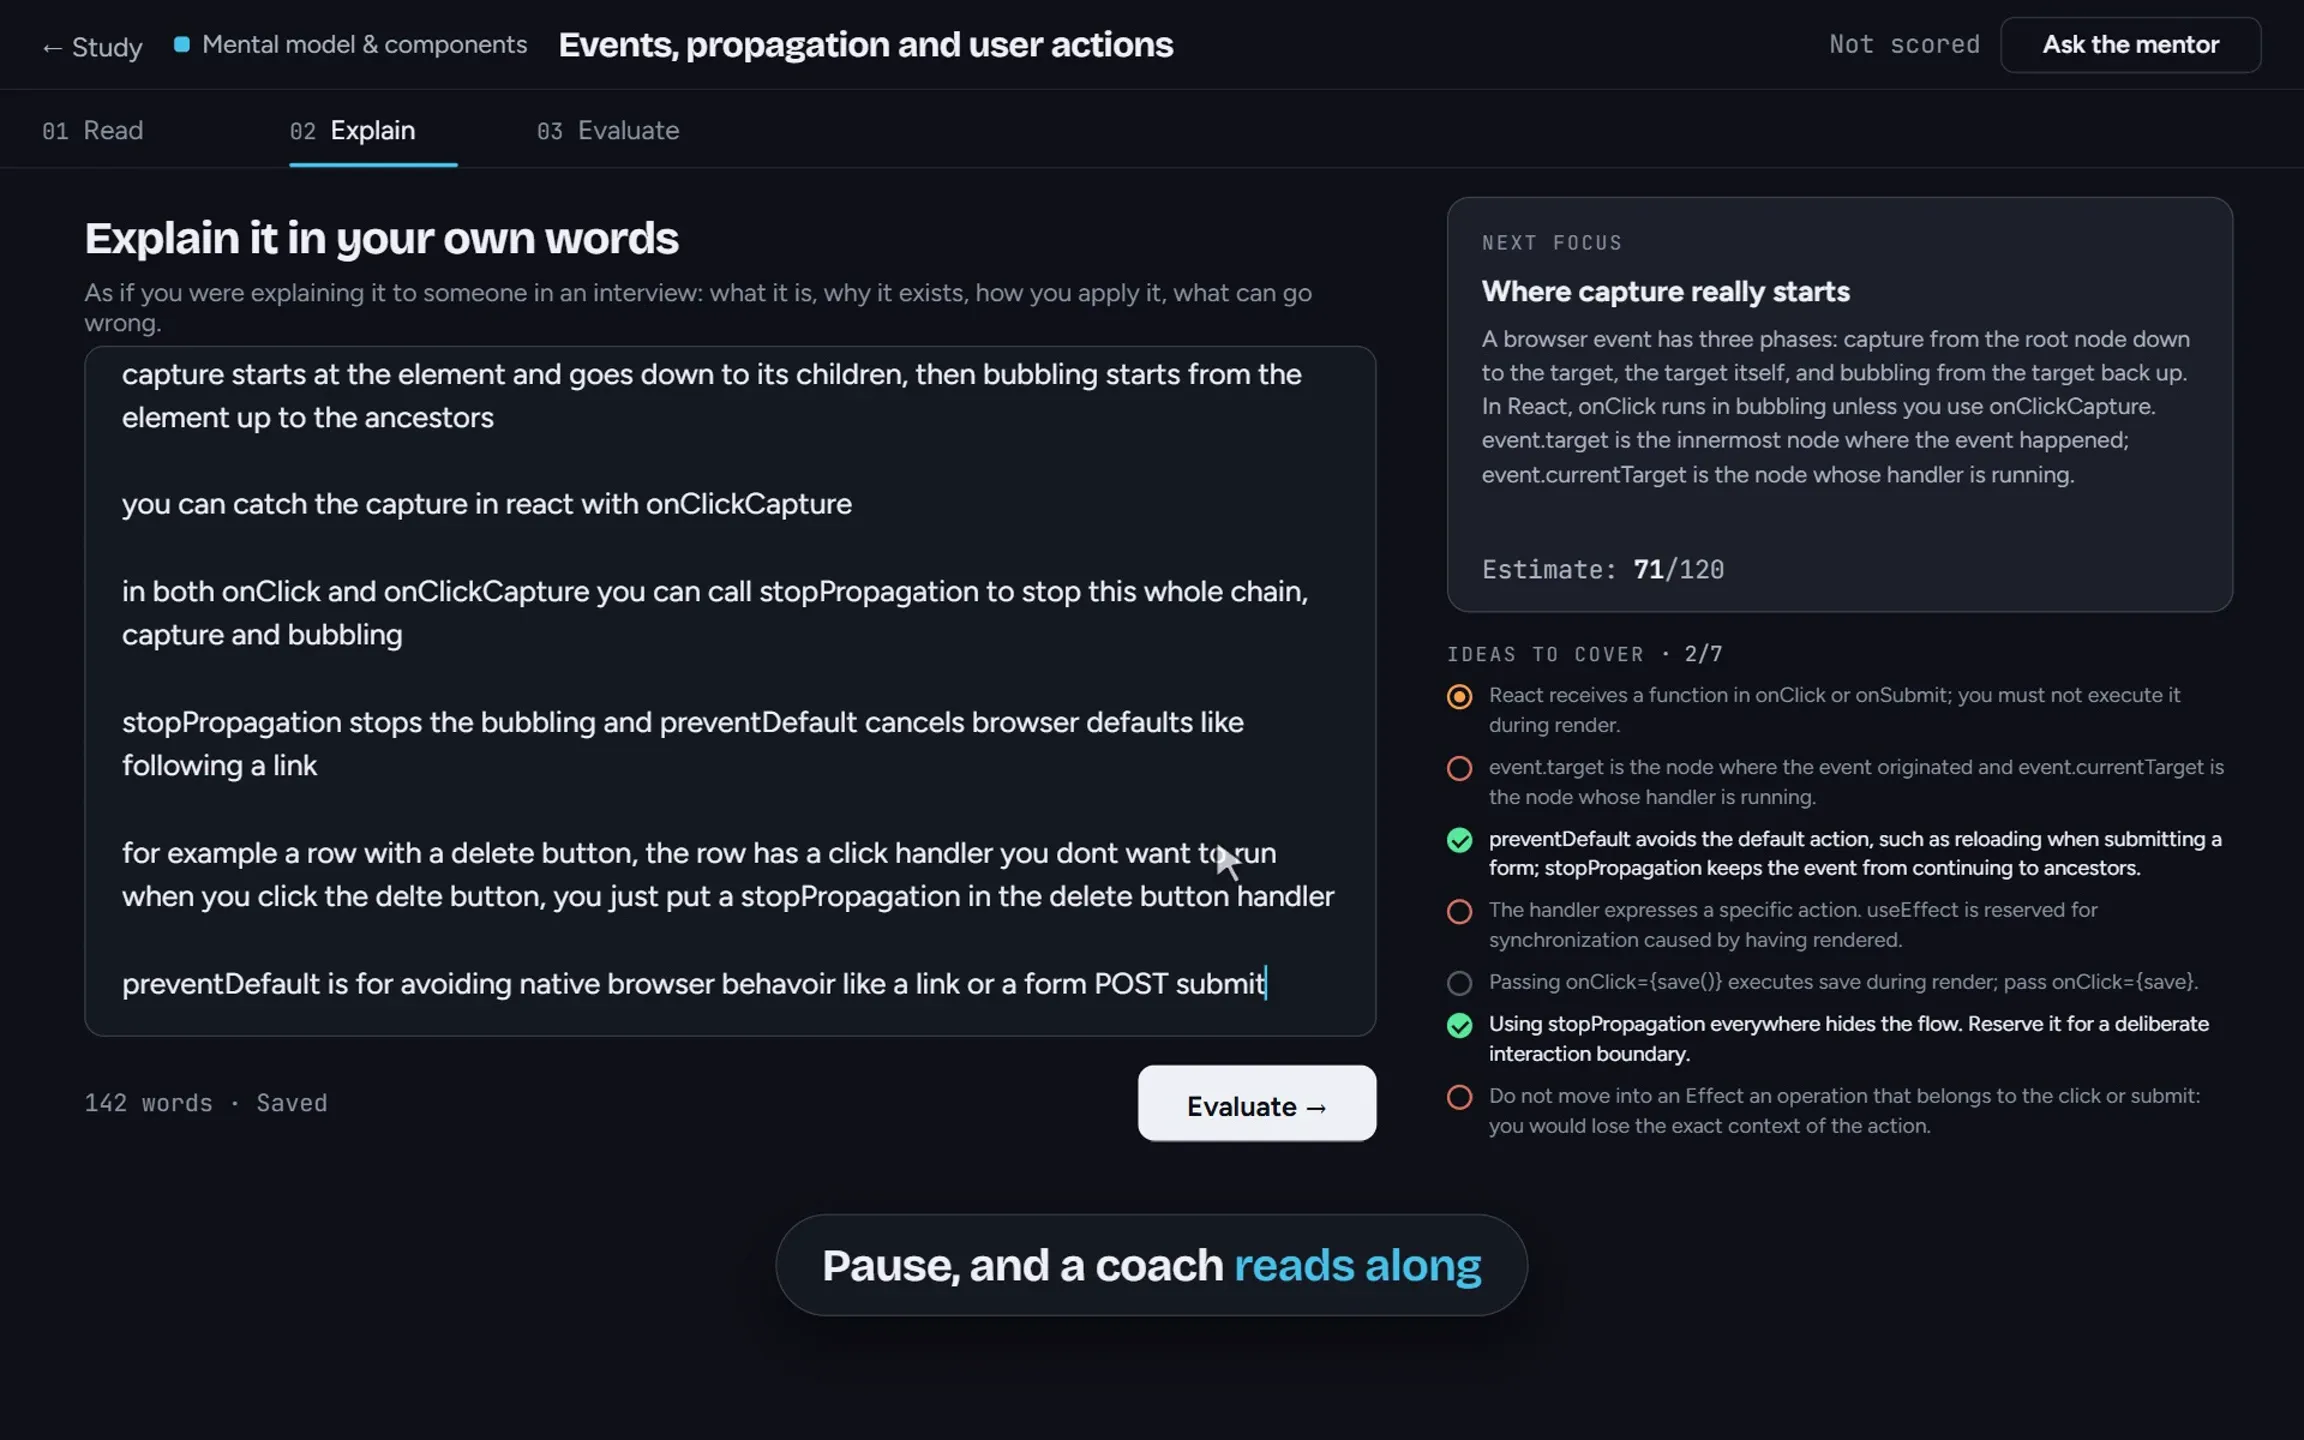
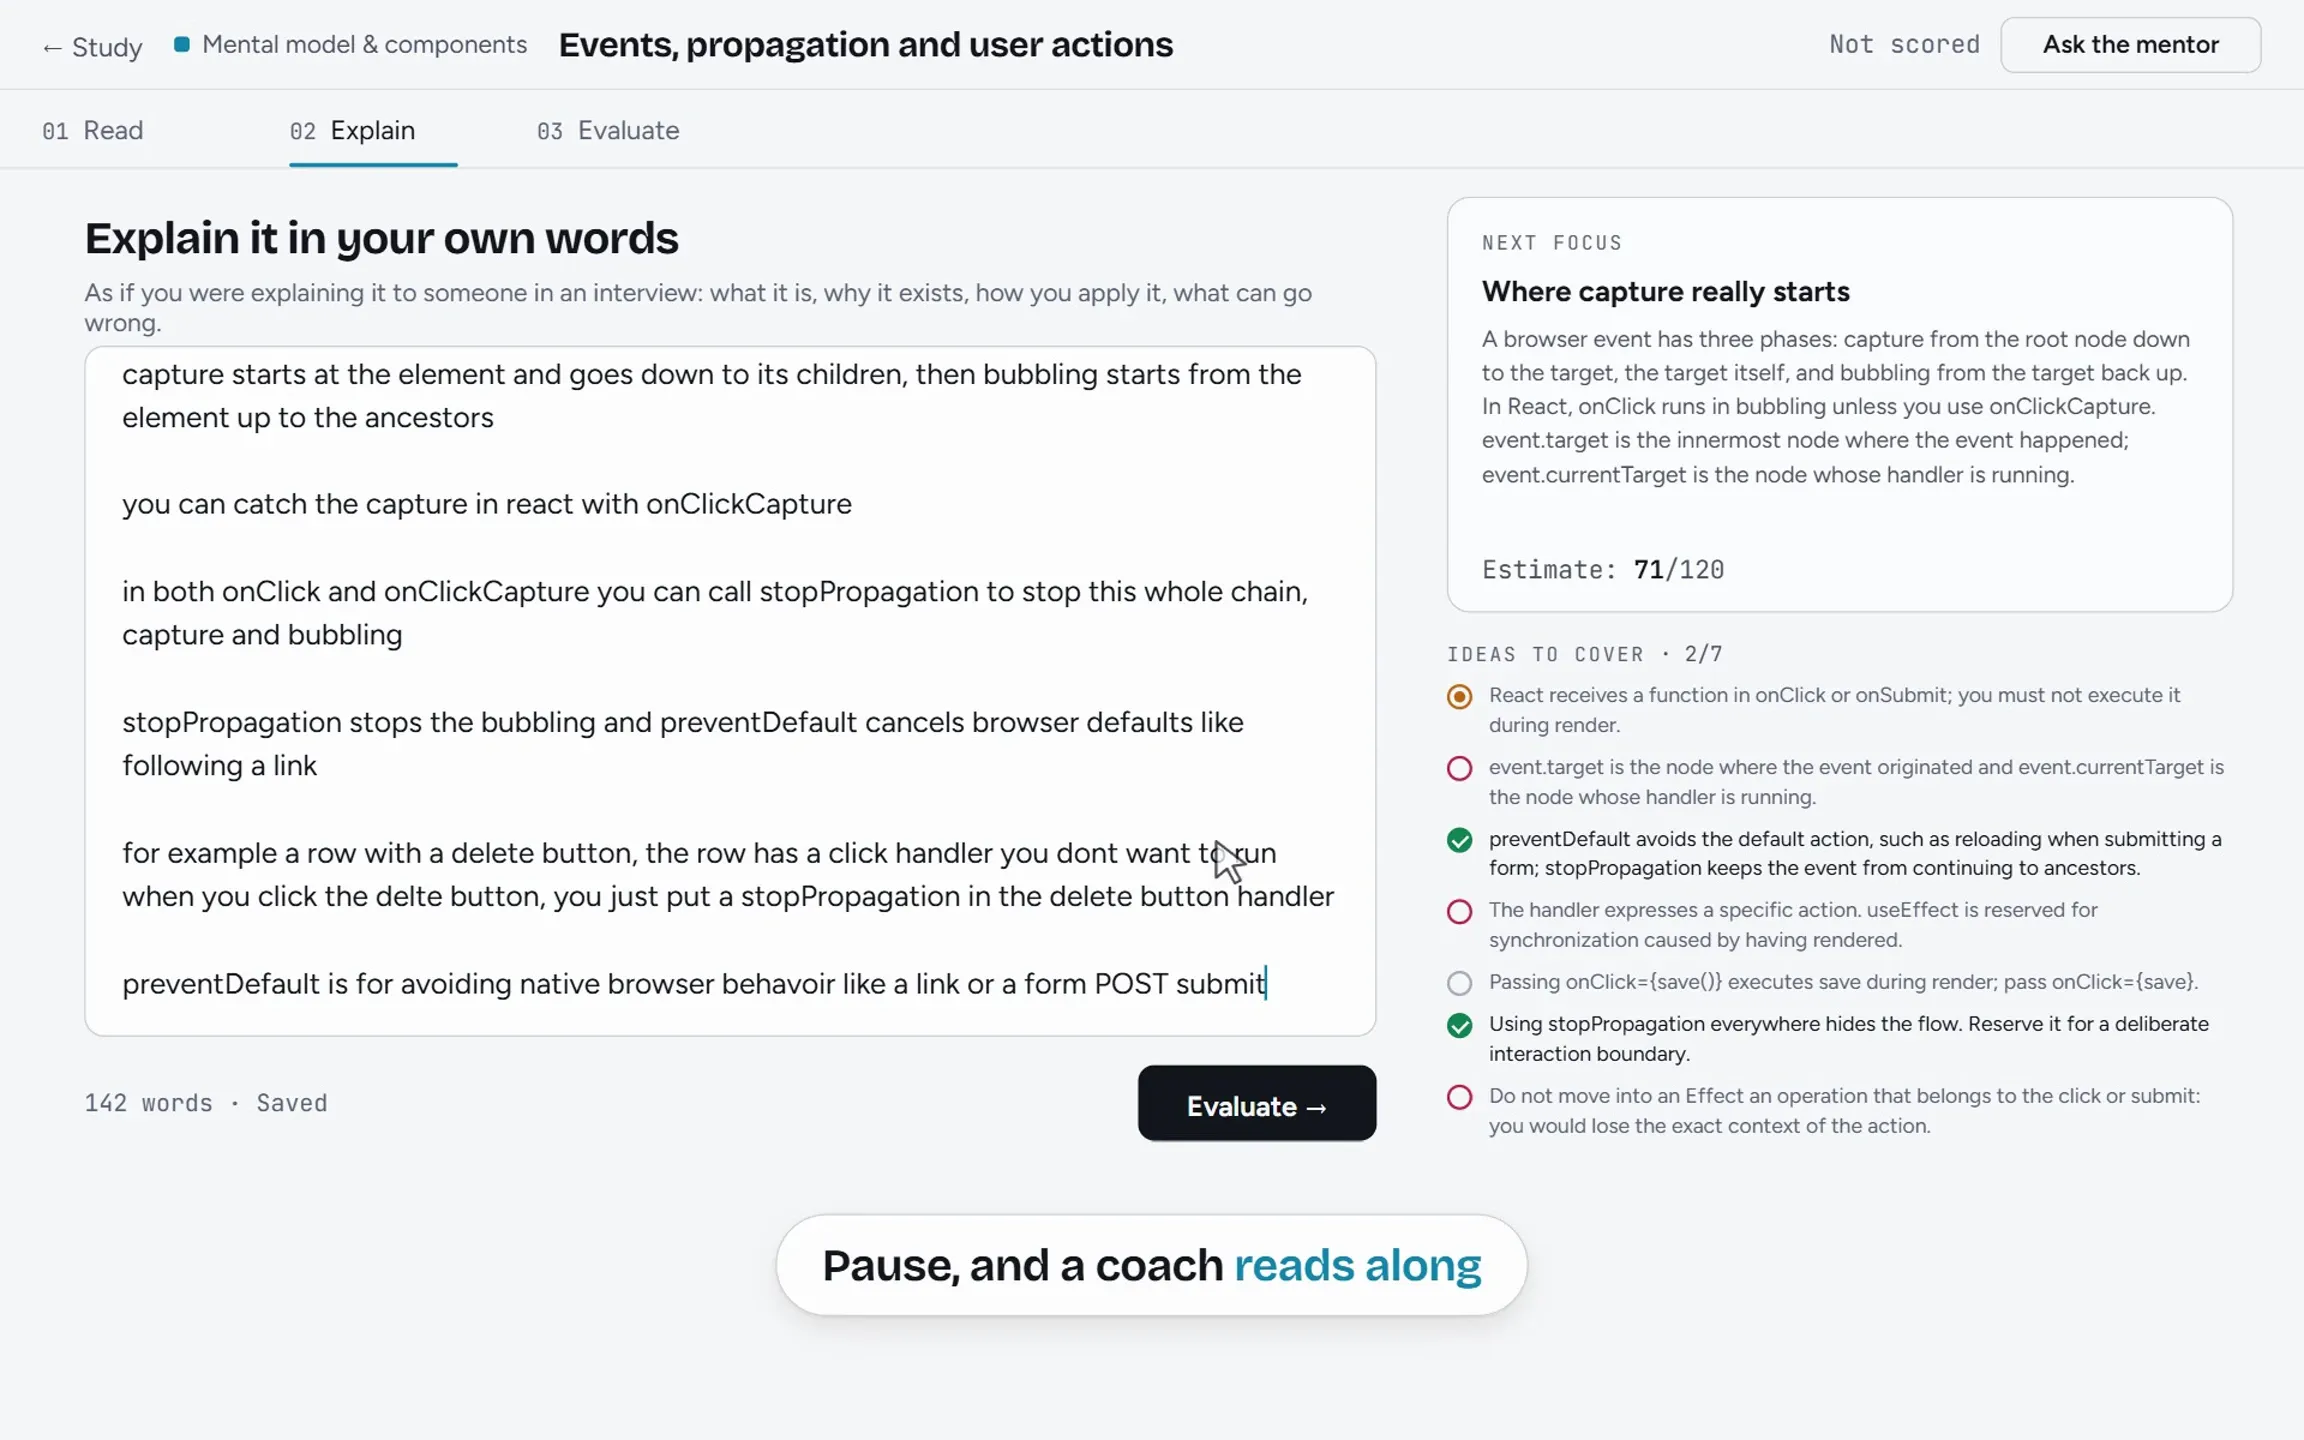
KnowGraph product video: a concept picked on the heat-grid map is explained in your own words, coached to 71 out of 120, discussed with the mentor, revised to 105, and evaluated at 118 against a four-part rubric, and its cell on the map fills in. This frame shows the Explain stage: the draft on the left, and on the right the coach’s next focus, an estimate of 71 out of 120 and the checklist of ideas to cover.KnowGraph product video: a concept picked on the heat-grid map is explained in your own words, coached to 71 out of 120, discussed with the mentor, revised to 105, and evaluated at 118 against a four-part rubric, and its cell on the map fills in. This frame shows the Explain stage: the draft on the left, and on the right the coach’s next focus, an estimate of 71 out of 120 and the checklist of ideas to cover.
  1. You explain the concept in your own words, typed or dictated.
  2. When you pause, a coach estimates the score and points at the next gap.
  3. The card’s essential ideas, marked as you cover them.

Engineering

Three things worth a closer look

  1. 01

    Graph layout without D3

    Kahn topological ranking that tolerates cycles, then eight barycenter sweeps to cut edge crossings. Hovering a node lights its whole prerequisite chain and what it unlocks; a minimap keeps the rest of the curriculum in view.

  2. 02

    Rendering JSON as it streams

    The evaluation arrives as structured JSON over SSE and is parsed incrementally, so rubric fields fill in while the model is still writing. Zod validates the final object.

  3. 03

    A headless core

    A framework-free controller wired to React through useSyncExternalStore replaced a 2,642-line App.jsx. Evaluations keep running in the background and stay in sync across tabs with BroadcastChannel.

  • React 19
  • Vite
  • Node gateway
  • Zod
  • Server-sent events
  • IndexedDB
  • Mermaid
  • Playwright
  • Electron

More screens from KnowGraph

Select a screen to enlarge it

Study session, Read stage
Dependency graph
Review: rate a card to schedule it

Build sheet

Stack
React 19, Vite, Node gateway, Zod, Server-sent events, IndexedDB, Mermaid, Playwright, Electron
Scale
  • 167 commits
  • 142 concepts, 266 links
  • 10 ADRs
  • 48 Playwright tests
Typefaces
  • Bricolage Grotesque
  • Figtree
  • JetBrains Mono
Palette
#0E1117#EEF1F6#3DB9EE#FFA347#43D69B